Every feature earns its place.
Institutional-grade tools, each built on primary-source SEC data and transparent methodology. Explore what each one tells you.
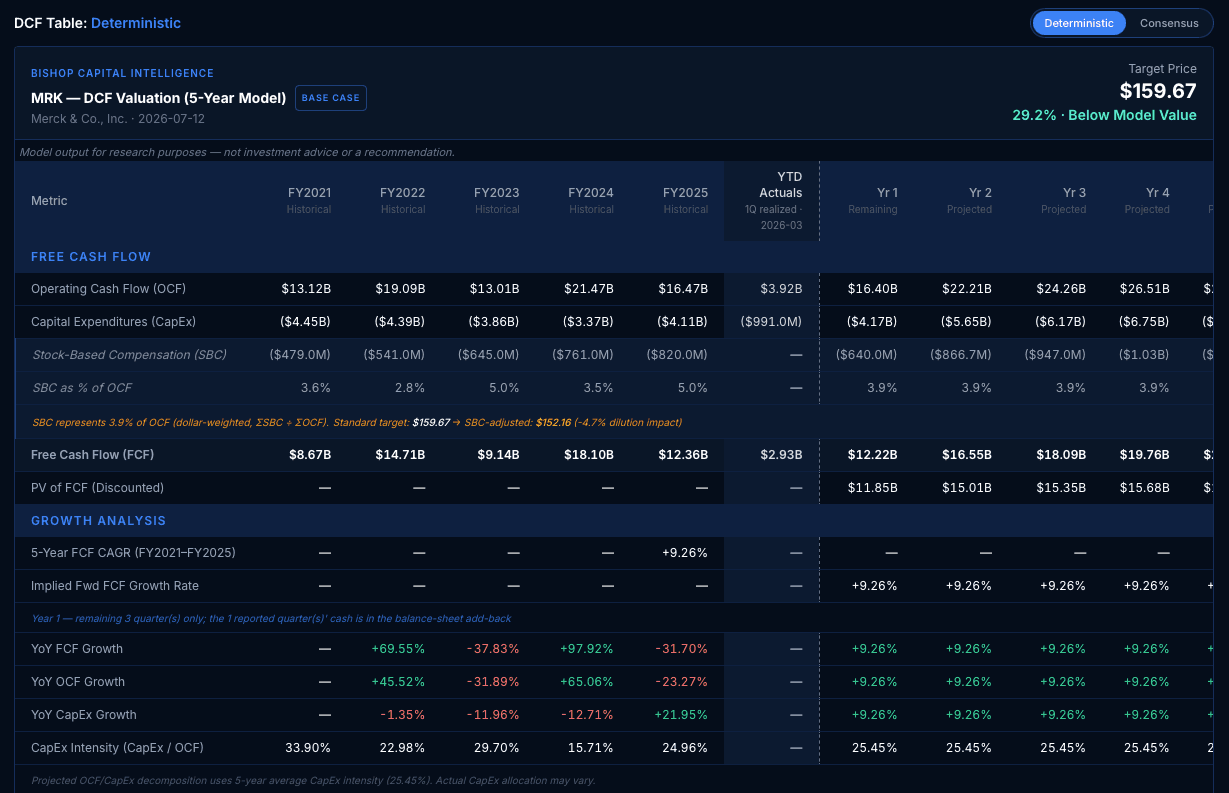
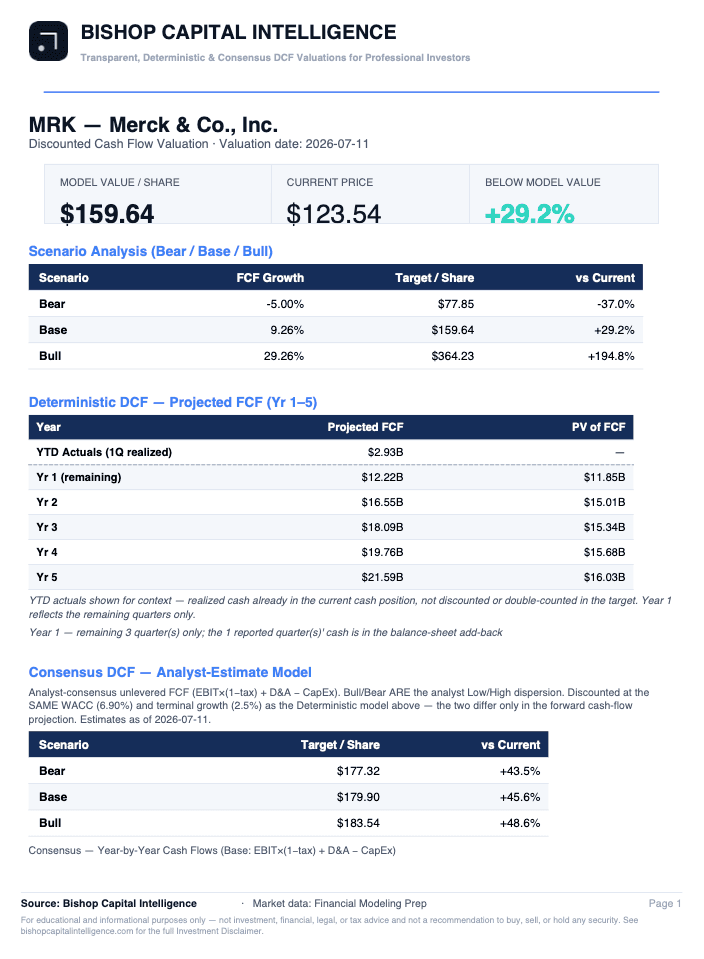
Deterministic 3-Scenario DCF
Bear, base, and bull DCF valuations built deterministically from a company's own SEC filings — the same math every time, with nothing hidden.
Illustrative example as of July 12, 2026. For informational and research purposes only — not investment advice.
Learn more →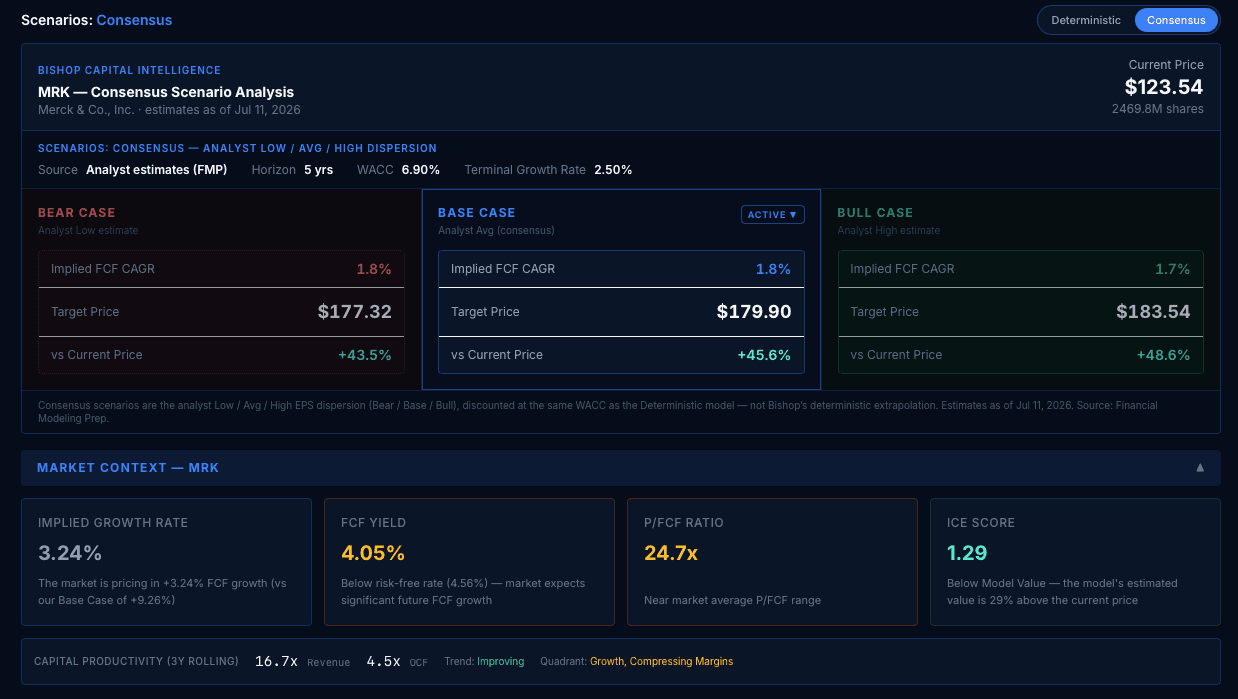
Consensus 3-Scenario DCF
Three-scenario DCF valuation driven by analyst consensus estimates — see what Wall Street's own forecasts imply about fair value.
Illustrative example as of July 11, 2026. For informational and research purposes only — not investment advice.
Learn more →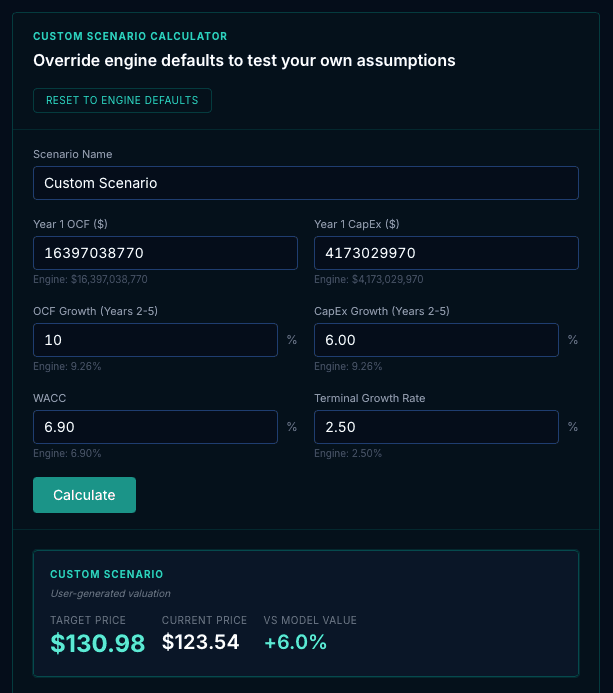
DCF Calculator
Run your own scenario analysis through BCI's valuation engine — your growth rates, your capital spending, your discount rate.
Illustrative example. For informational and research purposes only — not investment advice.
Learn more →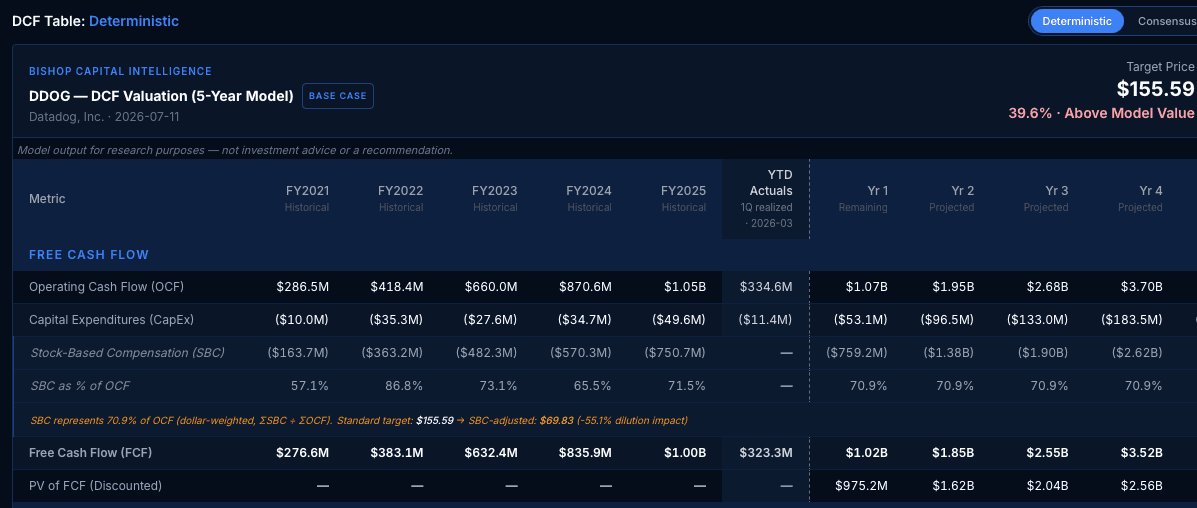
SBC-Adjusted Valuations
A parallel calculation recomputes free cash flow — and fair value — with stock-based compensation treated as the true cost it is.
Illustrative example as of July 11, 2026. For informational and research purposes only — not investment advice.
Learn more →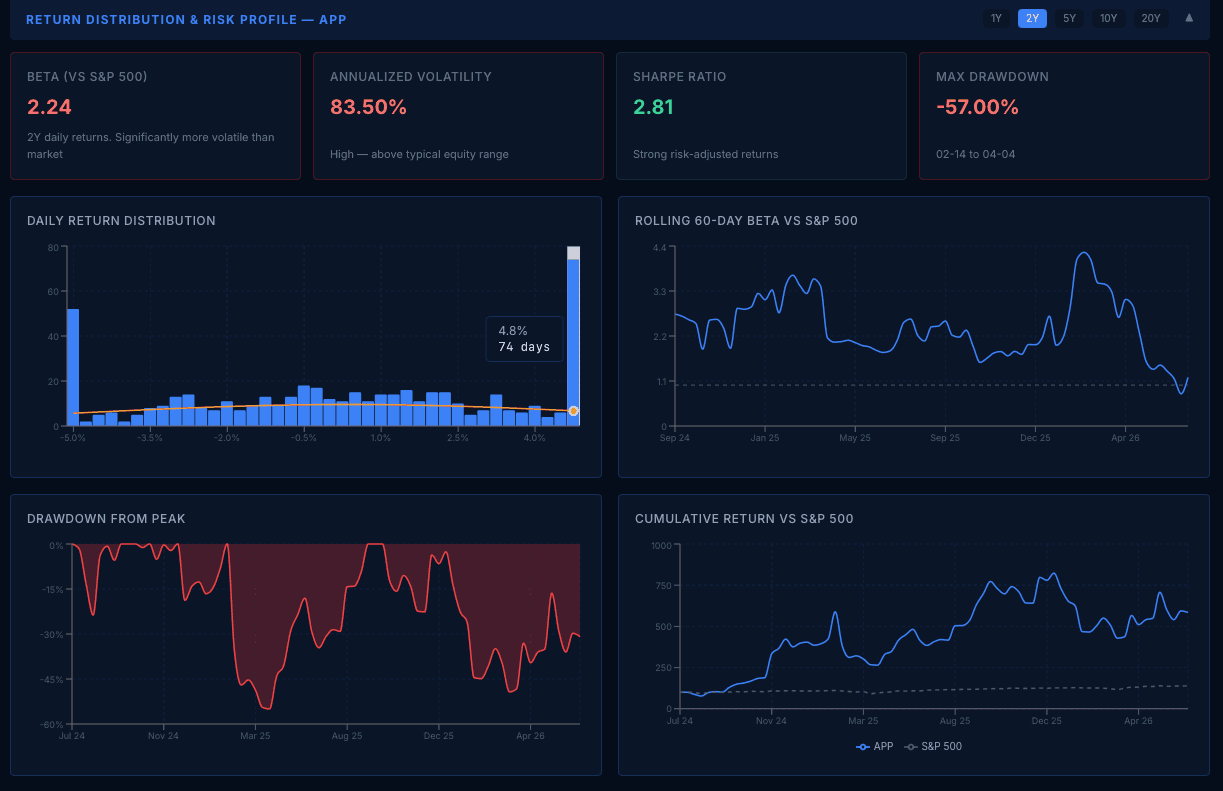
Distribution of Returns
The full historical return distribution of a stock — not just the average, but the tails you actually live through.
Illustrative example. For informational and research purposes only — not investment advice.
Learn more →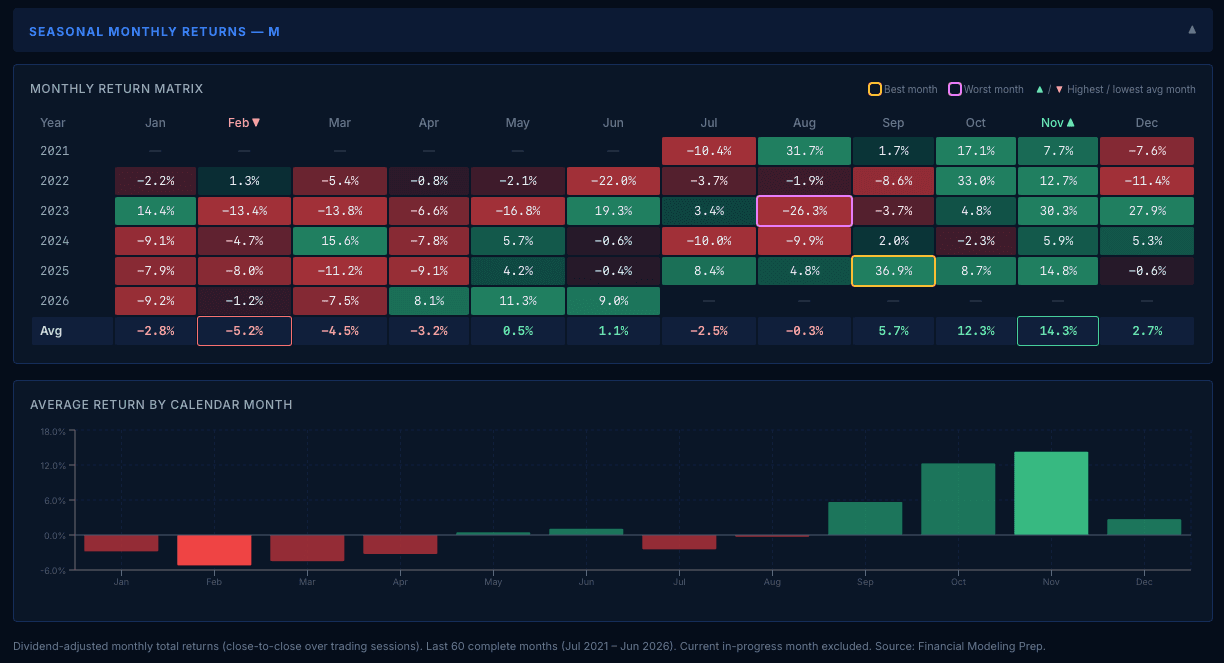
Seasonal Returns
A month-by-month matrix of historical returns — see how a stock has actually behaved across the calendar, year after year.
Illustrative example as of June 2026. For informational and research purposes only — not investment advice.
Learn more →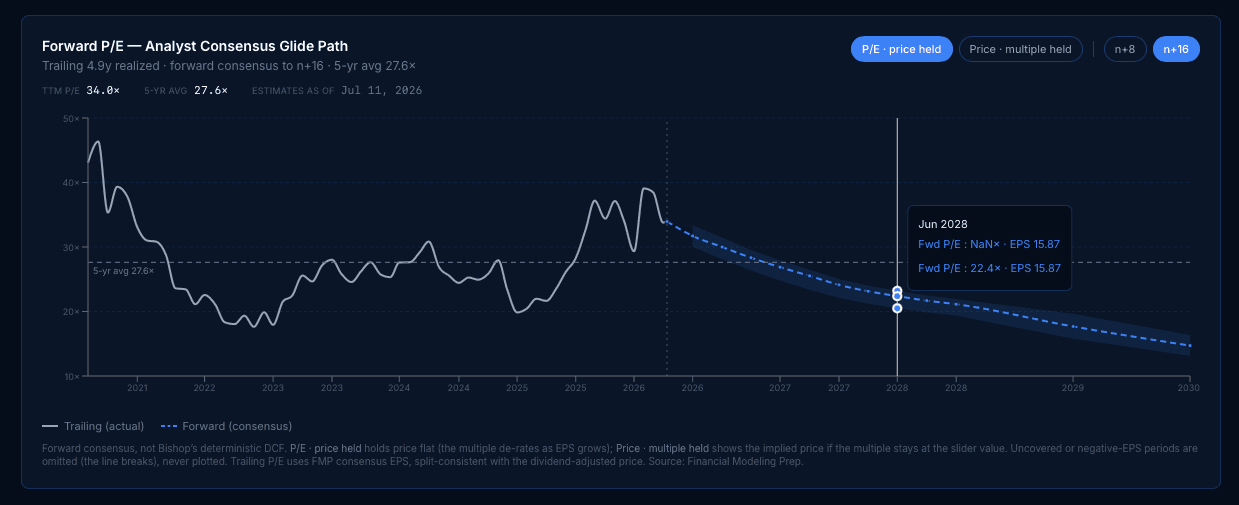
Forward P/E Tool
An interactive forward P/E tool grounded in forward estimates — see valuation the way professionals quote it.
Illustrative example as of July 11, 2026. For informational and research purposes only — not investment advice.
Learn more →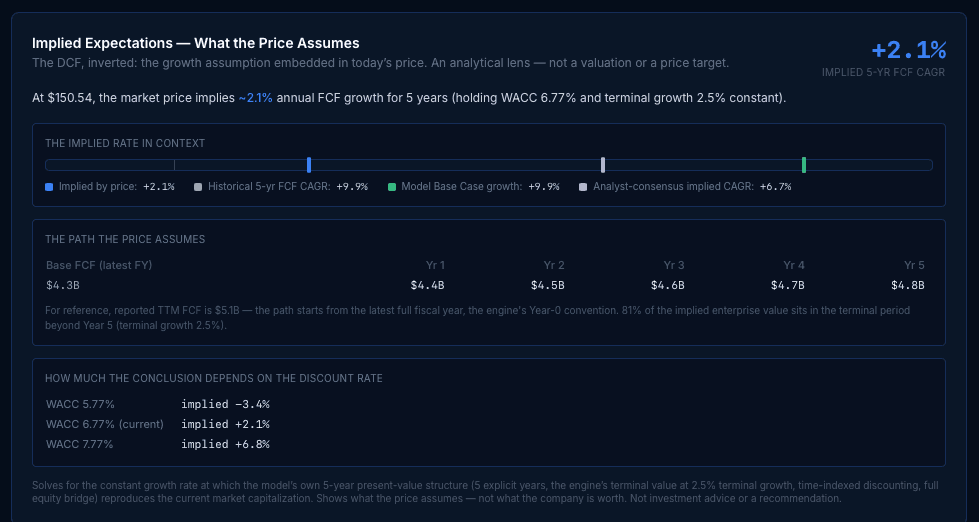
High-Growth Context Toolkit
A DCF on a growth-priced company produces a number that is true — and dismissible. The High-Growth Context Toolkit takes the honest path instead: it shows what the price assumes, whether history and consensus support it, and how efficiently growth becomes cash. No fair value. No price target. On purpose.
Illustrative example. For informational and research purposes only — not investment advice.
Learn more →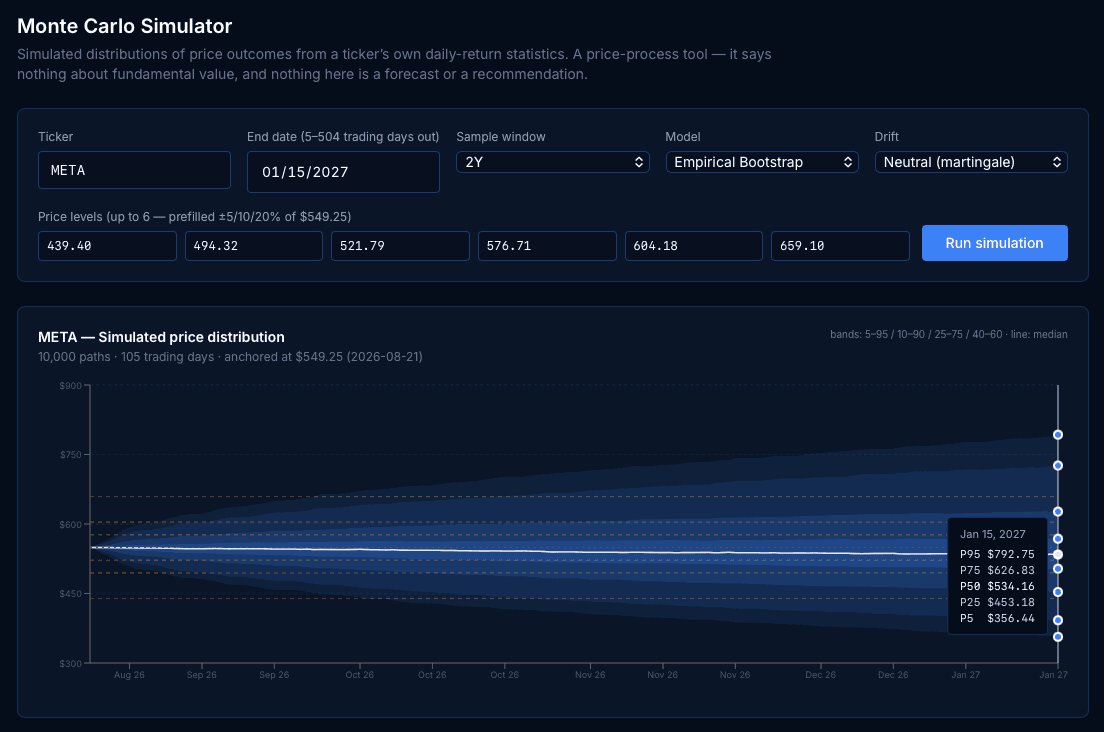
Monte Carlo Simulator
Ten thousand simulated paths. Your assumptions. The full distribution of outcomes — not a single guess.
Illustrative example. For informational and research purposes only — not investment advice.
Learn more →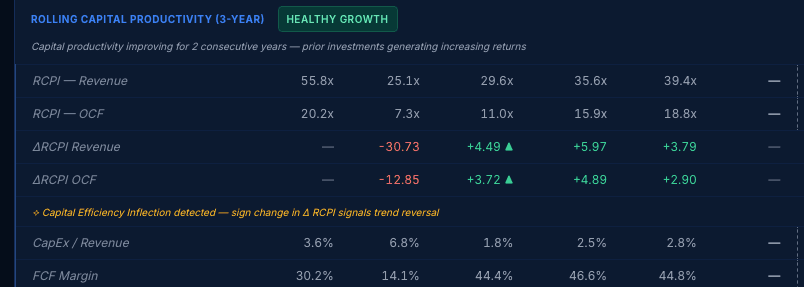
RCPI Inflection Detection
RCPI — the Rolling Capital Productivity Index, a proprietary measure of how productively a company converts capital into results — with automatic detection of inflection points.
Illustrative example. For informational and research purposes only — not investment advice.
Learn more →