Market Analytics
What are you paying for next year's earnings?
An interactive forward P/E tool grounded in forward estimates — see valuation the way professionals quote it.
What it tells you
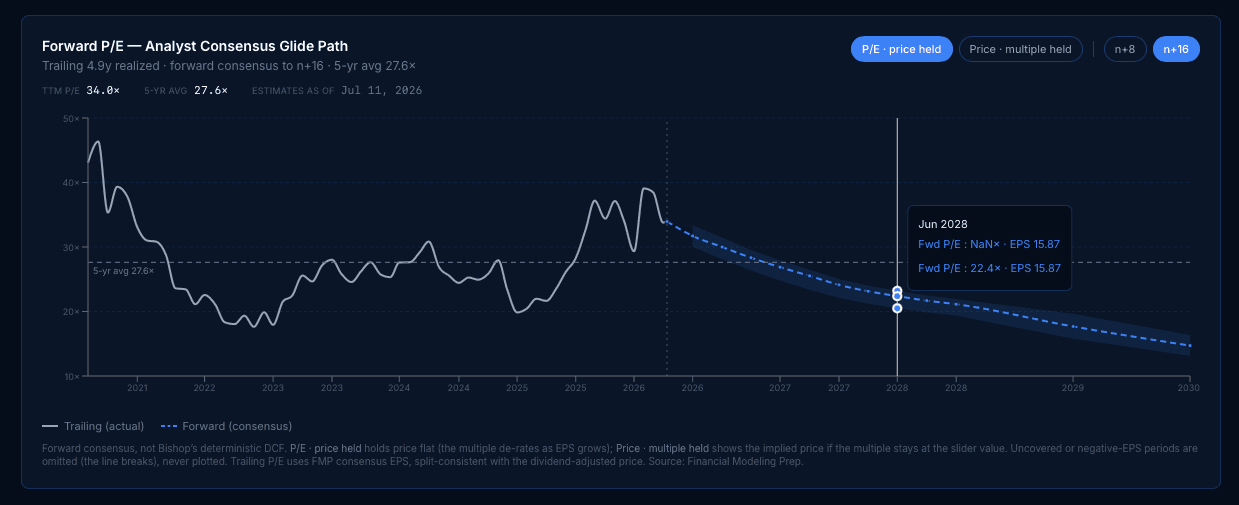
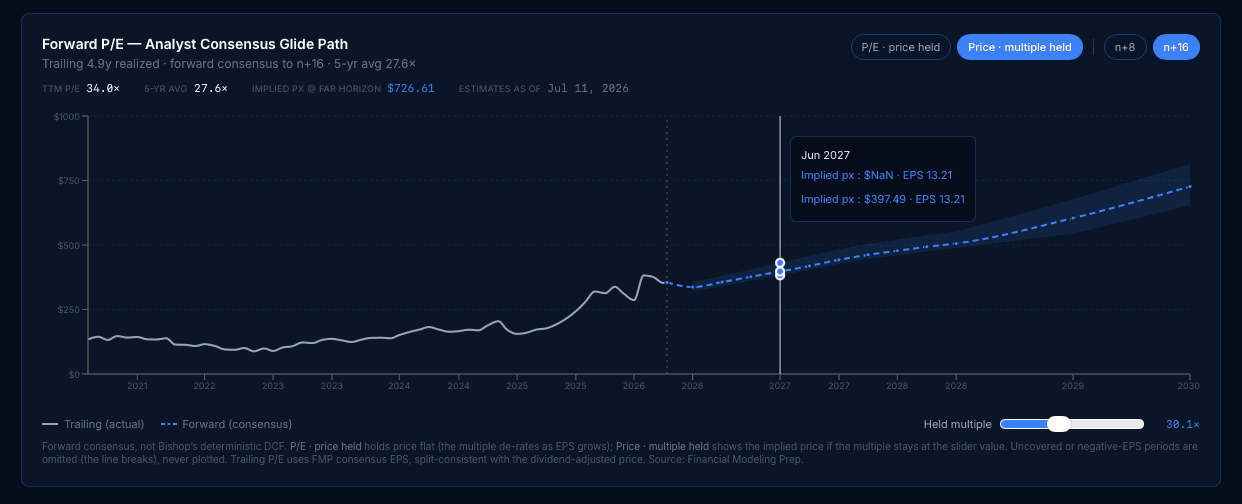
Trailing P/E tells you what a stock was worth relative to what already happened. The Forward P/E tool shows what you're paying for what comes next, interactively — flip between the multiple's path if the price holds and the implied price path if the multiple holds, and compare today's multiple with the company's own five-year history. It's the difference between reading yesterday's tape and pricing tomorrow's earnings.
Who it's for
For investors who know the market prices the future — and want their multiples to do the same.
How it works
- Analyst consensus EPS estimates (Financial Modeling Prep, cached daily) build the forward path, and the trailing five years of realized P/E lead into it on one continuous chart.
- Two framings of the same estimates: "P/E · price held" shows the multiple re-rating as earnings grow; "Price · multiple held" shows the implied price path at a multiple you set with a live slider, anchored to the stock's five-year average.
- A dispersion band shows the analyst low/high spread, over a horizon of 8 or 16 forward quarters plus forward fiscal years.
- Guarded math: loss quarters and uncovered periods break the line rather than plotting a misleading multiple, and points resting on three or fewer analysts are flagged amber.
- Its sibling, the Forward P/S glide path, renders directly below it — the same construction on analyst-consensus revenue, with the trailing line built from reported SEC quarterly revenue (never consensus history). For growth names where earnings-based multiples aren't meaningful yet, the sales multiple carries the story. Beneath them sits the Rule of 40 growth-efficiency screen: TTM revenue growth plus TTM FCF margin from the same reported figures — a quality heuristic, never a valuation. And the Implied Expectations lens completes the family: it inverts the DCF to show the 5-year FCF growth today's price assumes — what the market believes, not what the model concludes.
Its structural sibling, Forward P/S, lives in the High-Growth Context Toolkit →
Included in Professional
Also in Institutional. Server-enforced.
Questions
- Why forward instead of trailing?
- Markets discount the future. Trailing multiples describe the past; forward multiples describe the bet you're actually making.