Three lenses for growth-priced stocks. Zero verdicts.
A DCF on a growth-priced company produces a number that is true — and dismissible. The High-Growth Context Toolkit takes the honest path instead: it shows what the price assumes, whether history and consensus support it, and how efficiently growth becomes cash. No fair value. No price target. On purpose.
What it is
Some companies are priced on belief in their future, not on their current cash flows. For those names, any tool that hands you a single "fair value" is manufacturing false confidence — and any tool that stays silent is useless. The HGC Toolkit is the third option: three composable, clearly labeled analytical tools that turn "the model says X, the market says Y" into a testable picture of what owning the stock requires believing.
The three tools
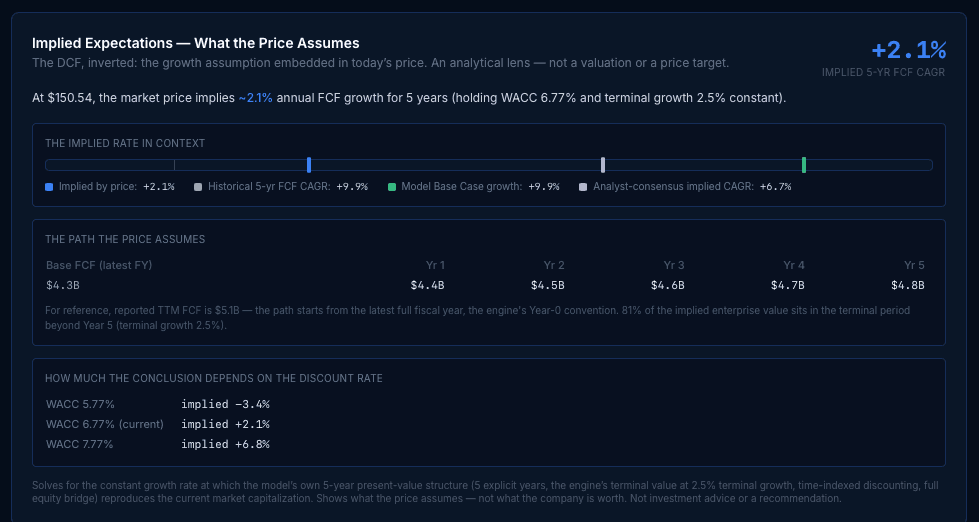
Implied Expectations
The Mauboussin question, operationalized. Instead of telling you the price is wrong, the panel inverts our own DCF machinery to show what the price assumes: the 5-year FCF growth rate that, at the company’s WACC and our standard terminal convention, exactly reproduces the current market cap. Alongside it: how that implied growth compares with the company’s historical FCF growth and analyst consensus, the year-by-year FCF path the assumption produces, and how the answer moves if the discount rate shifts by ±1 point. Engine-consistent to a round-trip tolerance of microns — and honest when it can’t answer (negative trailing FCF, or a price no bounded growth rate can reproduce, both render as clearly stated limits, never a guess).
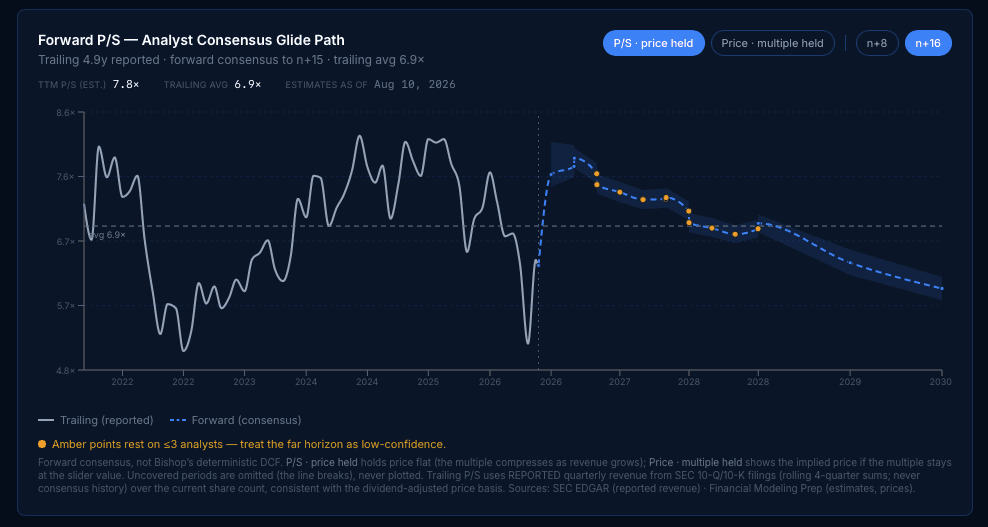
Forward Price-to-Sales
The multiple growth investors actually use, built the hard way: trailing P/S from SEC-reported quarterly revenue (extracted from EDGAR filings, with fail-closed guards against stale or ambiguous tagging), extended forward on analyst-consensus revenue. The structural sibling of our Forward P/E, rendered with the same honesty about estimate depth.
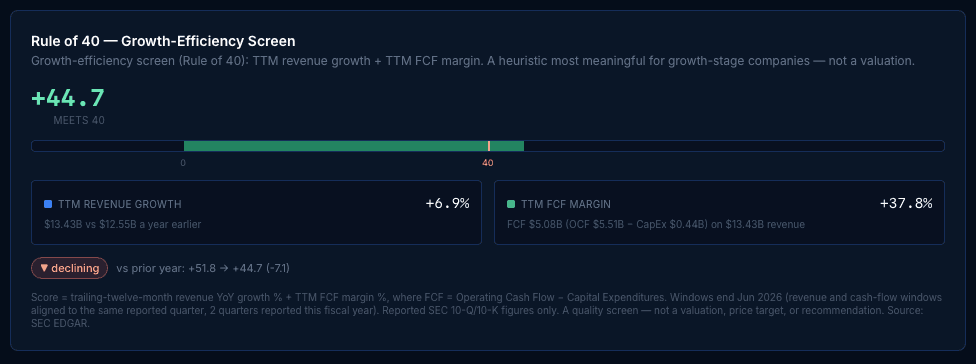
Rule of 40
Growth plus efficiency in one number: trailing-twelve-month revenue growth % plus FCF margin % (FCF = operating cash flow minus capex — the platform’s standard, arguably the most honest form of the rule). Shown decomposed into its two components with a reference marker at 40 and, where the data fully supports it, a prior-year score with a trend arrow. A screen for how efficiently growth converts to cash — explicitly not a valuation.
Reading them together
On a growth-priced name, the three lenses answer three independent questions: What does the price assume? How is the market multiple positioned? Is growth converting to cash efficiently? When all three point the same direction, you have a coherent — and falsifiable — picture of the bet the market is making. The platform issues no verdict. You leave with the assumptions on the table, which is where a serious decision starts.
Who it's for
For investors who own growth names and are tired of tools that either flatter them with a made-up fair value or dismiss them with a number nobody believes.
Also in Institutional. Server-enforced for all three tools — Free receives the locked-feature state.
Questions
- Is this a valuation?
- Deliberately not. No HGC output is a price target or an over/under verdict. The toolkit shows you what the price assumes and whether the company’s record supports it — the analysis that comes before a judgment, with the judgment left to you.
- Why not just produce a fair value for growth stocks?
- Because no defensible method exists that does, and a confident wrong number is worse than an honest frame. We’d rather hand you a falsifiable picture than a fictional target.
- What happens when the data can’t support an answer?
- The tool says so, specifically — negative trailing free cash flow, insufficient clean quarterly history, or stale filings each render an explicit honest state instead of a guess.