Monte Carlo Simulator
Ten thousand simulated paths. Your assumptions. The full distribution of outcomes — not a single guess.
What it is
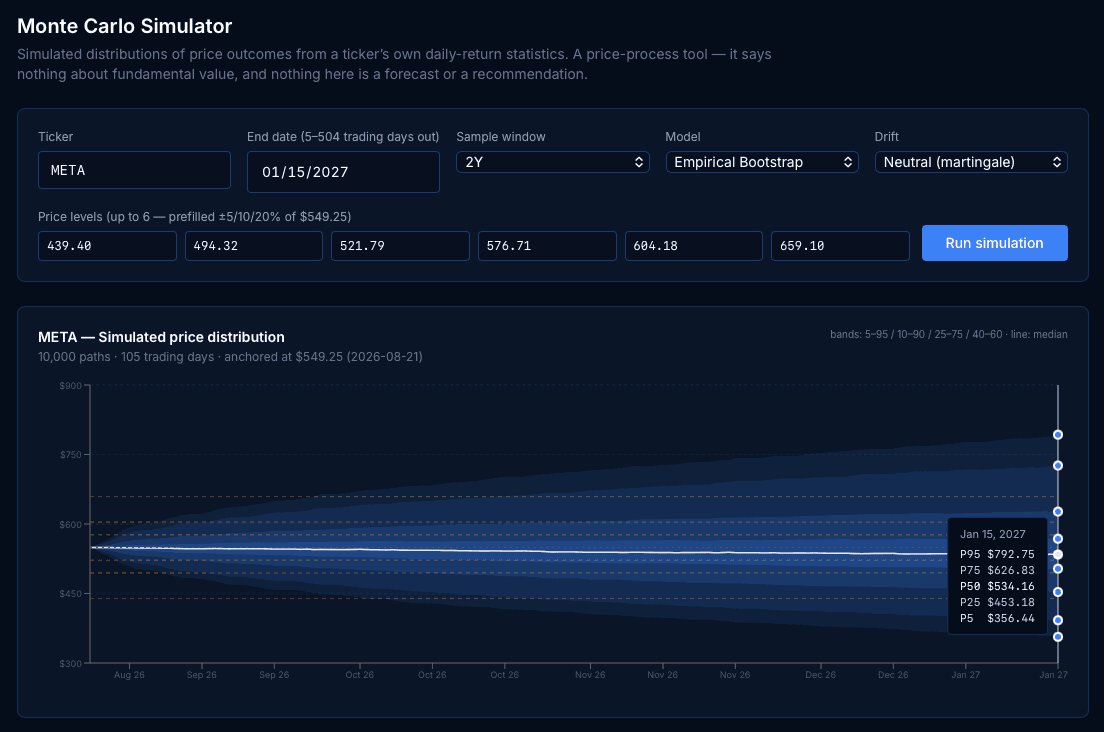
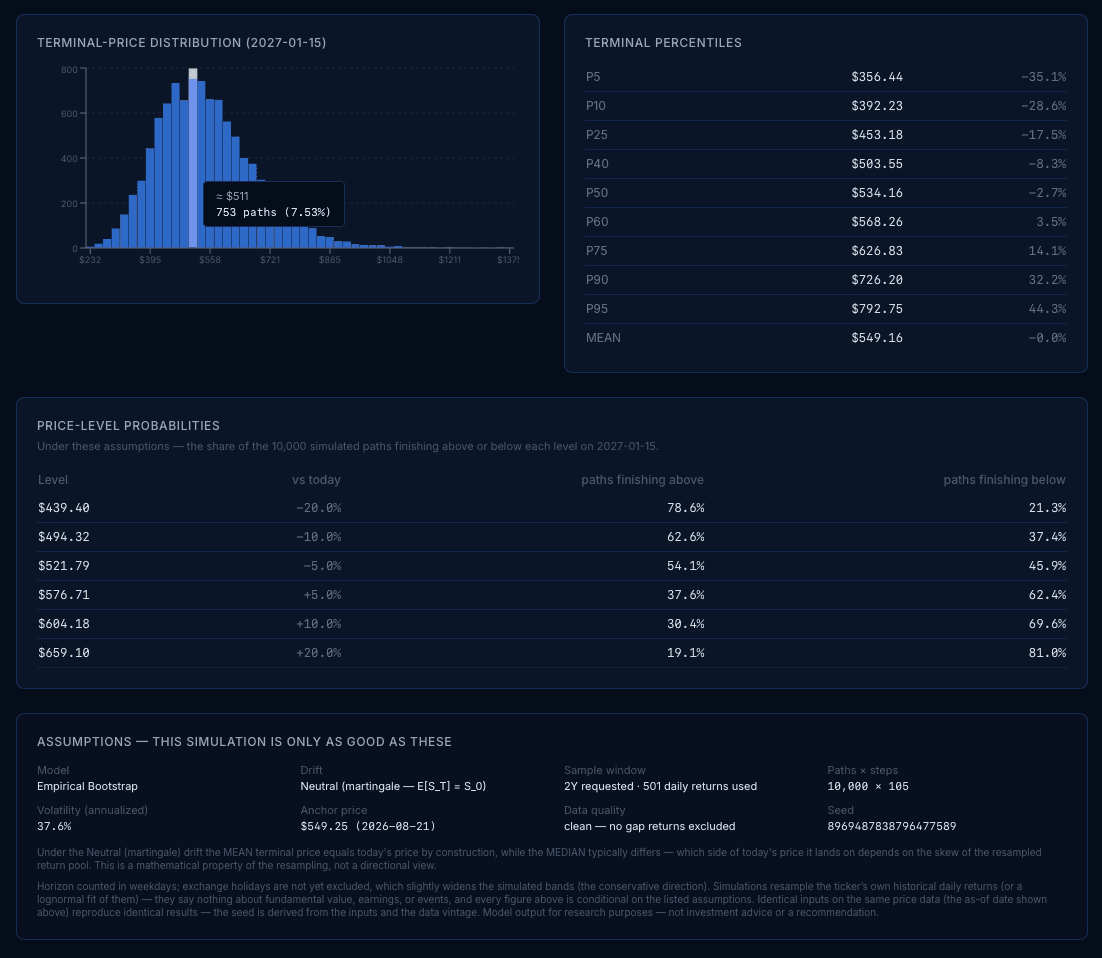
Pick any ticker and any date up to two years out — an earnings quarter, a year-end, an options expiration. The Simulator runs 10,000 price paths from the stock's own return history and shows you the whole distribution: a probability cone over time, the terminal-price histogram, percentile bands, and the share of simulated paths finishing above or below price levels you set. Two engines — an Empirical Bootstrap that preserves the stock's real fat tails, and a classic Lognormal (GBM) model — with Neutral (martingale) drift by default, so the tool never smuggles in a direction. Every run is deterministic and reproducible, every assumption is displayed beside the results, and the data-quality screen would rather tell you "insufficient data" than render confident noise.
Why it's different
Distribution-faithful, not bell-curve-naive
The default Empirical Bootstrap resamples the stock's actual return history, preserving the fat tails and skew a normal model smooths away.
Honest by default
Neutral (martingale) drift means no baked-in direction; directional assumptions must be chosen, and are labeled — Risk-free, or Historical (assumes past trend continues).
Reproducible
Identical inputs produce identical results, seed displayed. Research-product behavior, not a slot machine.
Refuses to guess
The data-quality gate declines to simulate on degraded price series rather than render clean-looking noise.
Universal coverage
Renders for every ticker, including heavily-traded names traditional valuation frameworks can't cleanly cover.
Who it's for
For practitioners who think in distributions — and want every assumption on the table next to the result.
How it works
- Any ticker, any horizon from 5 to ~504 trading days — including expirations
- Empirical Bootstrap (default) resamples the stock's actual daily returns — fat tails included
- Probability cone, terminal histogram, percentile table, and a strike-level table for up to six price levels
- Neutral drift by default; risk-free and historical drift available and labeled
- Deterministic and reproducible — same inputs, same results, seed displayed
- Renders for every ticker, including names outside traditional valuation coverage
Works together with
Exclusive to Institutional. Server-enforced — Professional sees an upgrade card; Free has no access.
Questions
- Is this a price prediction?
- No. It displays model-conditional simulated distributions under assumptions you choose and can see. It says nothing about what a stock will do or what it is worth.
- Why is the share of paths above today's price slightly under 50% under Neutral drift?
- Under a martingale, the average simulated price equals today's price, but the distribution is right-skewed — the median sits below the mean. That's the mathematics of compounding returns, not a bearish tilt.
- Why do I get identical results when I rerun it?
- By design — runs are deterministic and seeded from your inputs so results are reproducible and citable.
- Why did I get “insufficient data quality”?
- The screen found gaps or halts in the price series that would make a simulation misleading. The tool refuses to simulate rather than render confident noise.
- Does it use implied volatility?
- v1 uses realized return history over your selected window. Implied-volatility inputs are on the roadmap.
Simulation outputs are model-conditional statistics under displayed assumptions — not predictions, and they say nothing about fundamental value. For informational and research purposes only — not investment advice.