Three scenarios. Every assumption visible.
Bear, base, and bull DCF valuations built deterministically from a company's own SEC filings — the same math every time, with nothing hidden.
What it tells you
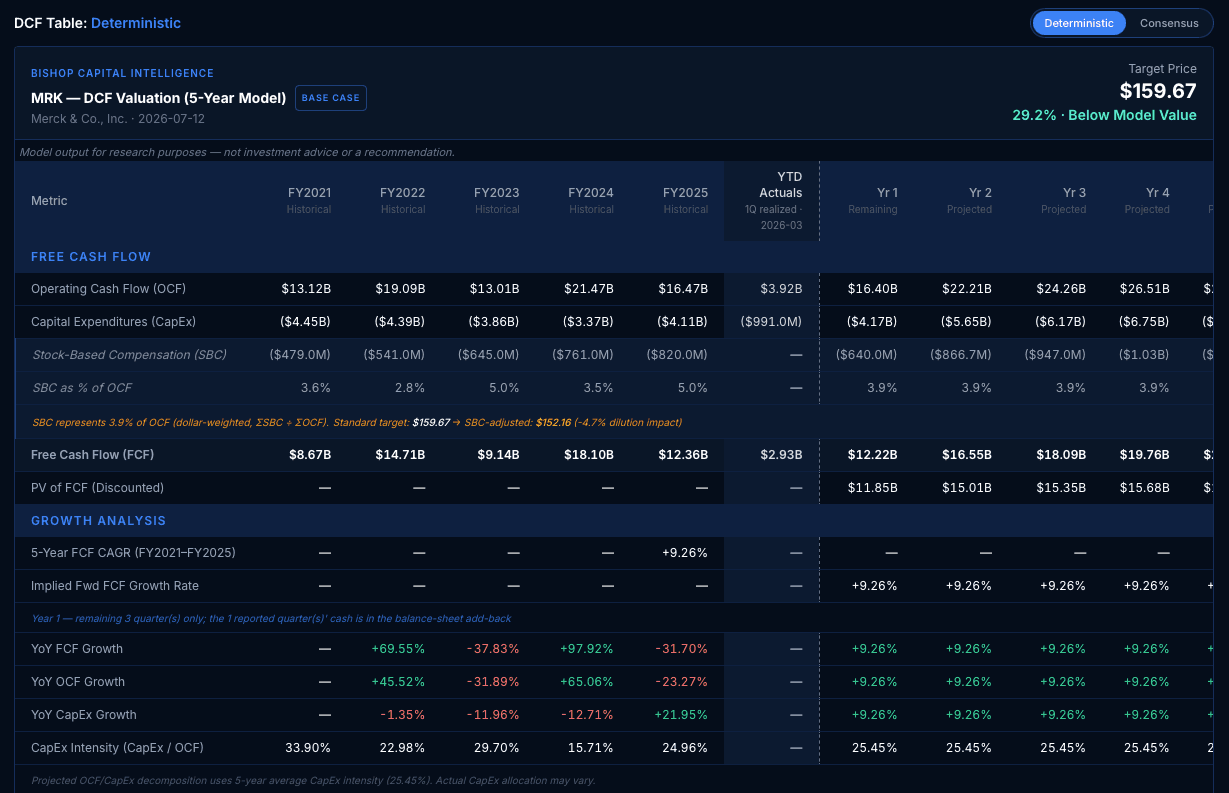
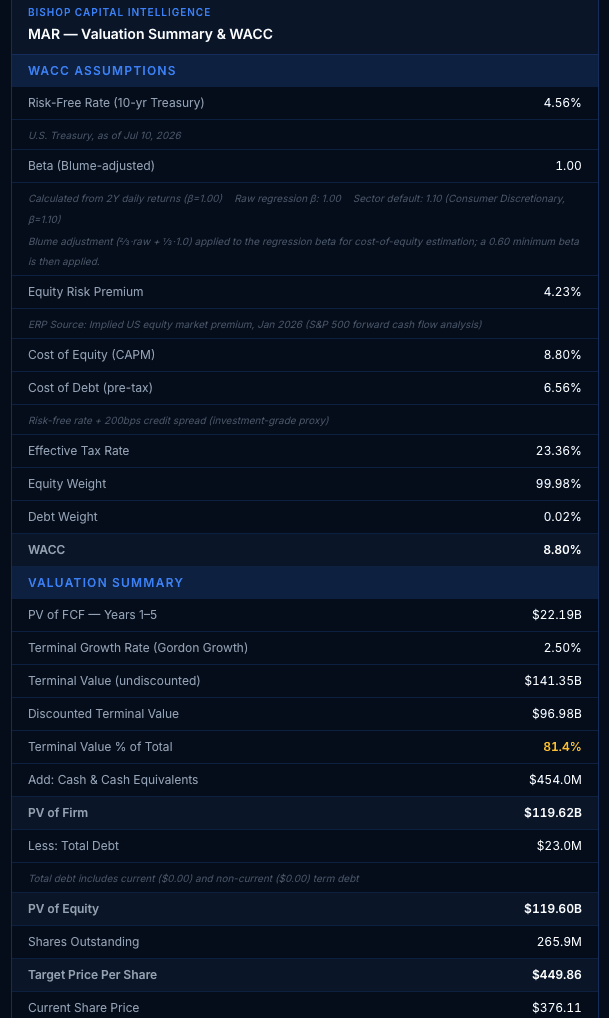
A single-number valuation asks for your trust. This engine hands you three — a bear, base, and bull fair-value estimate — and shows the full chain of assumptions behind each: the free-cash-flow growth path derived from the company's own filing history, the complete cost-of-capital build-up, and the terminal value with its share of the total. Because the model is deterministic, identical inputs always produce identical outputs. You can see exactly why the model believes what it believes, and exactly where you disagree.
Who it's for
For the analyst who has never once trusted a black box — and never should.
How it works
- Free cash flow — operating cash flow minus capital expenditures — is extracted from SEC EDGAR 10-K and 10-Q filings, five years of history per company.
- Bear, base, and bull growth rates are derived statistically from the company's own FCF history — mean ± 1σ for stable growers, historical percentiles for volatile ones — with published guard rails (−5% bear floor, +50% bull cap), and a visible footnote whenever a rail binds.
- The discount rate is built by CAPM from a live-cached 10-Year U.S. Treasury yield, shown with its as-of date, and a Blume-adjusted beta computed from two years of daily returns — with a disclosed sector-average fallback for short-history names.
- Each scenario discounts five projected years plus a Gordon-growth terminal value; the terminal value's share of the total and ±1-percentage-point sensitivities are disclosed on screen.
- Mid-fiscal-year valuations separate realized year-to-date quarters from projected ones, so cash already reported is never double-counted in the target.
Free: 3 unique tickers per rolling 7 days · Professional: 100 distinct tickers per calendar month · Institutional: unlimited.
Questions
- How is this different from analyst price targets?
- Price targets are opinions. This is arithmetic — a transparent model applied uniformly to primary-source data, which you can inspect and challenge at every step.
- Can I change the assumptions?
- Yes — the DCF Calculator lets you run the same engine on your own inputs.