Every month has a track record.
A month-by-month matrix of historical returns — see how a stock has actually behaved across the calendar, year after year.
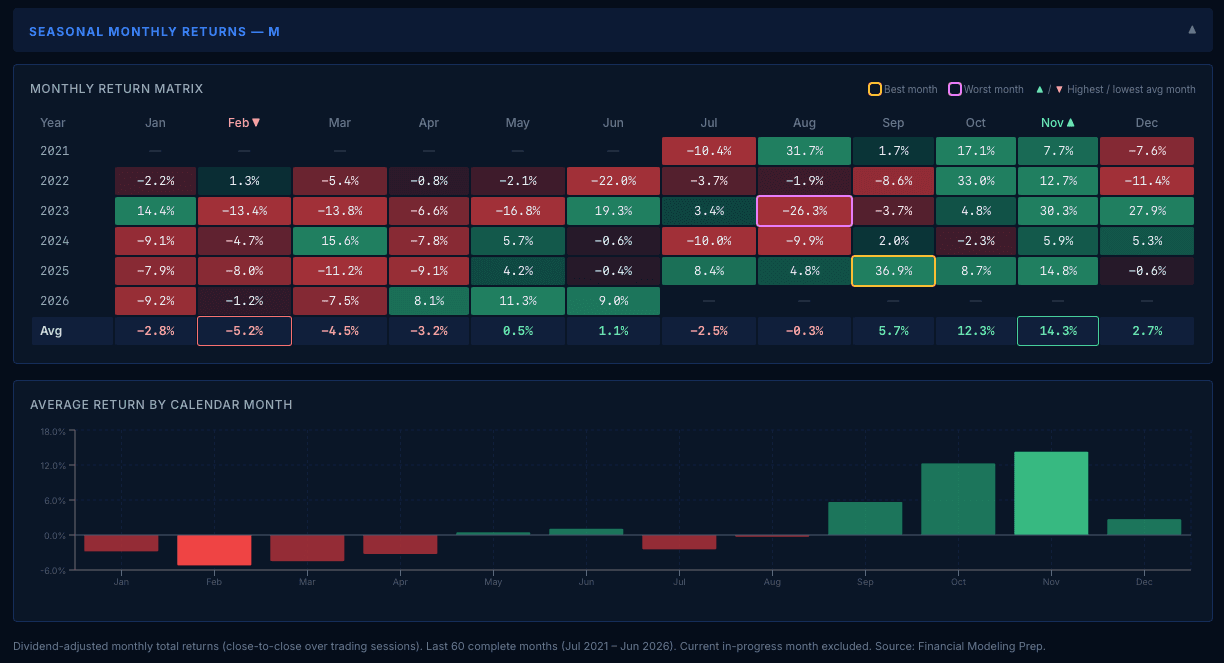
What it tells you
The Seasonal Returns table lays out a stock's monthly total returns — dividends included — for the most recent 60 complete months (5 years) on Professional — and up to 120 complete months (10 years) on Institutional — as a single matrix: every January next to every other January. Patterns of strength and weakness across the calendar become visible at a glance, as does the consistency (or inconsistency) behind seasonal folklore. Whether you time entries or simply want to know what turbulence is historically normal for a holding, the matrix replaces anecdote with the actual record.
Who it's for
For investors who'd rather see five — or ten — years of Septembers than be told a story about one.
How it works
- Monthly total returns — close-to-close over actual trading sessions, dividends included — are computed fresh from dividend-adjusted prices on every request.
- The most recent complete calendar months — 60 (5 years) on Professional, up to 120 (10 years) on Institutional — are arranged as a year-by-month heatmap; the current in-progress month is always excluded, and partial months are never blended into a fake return.
- An average row and companion bar chart summarize each calendar month's tendency, and the single best and worst months in the window are highlighted automatically.
- Historical record only — no predictive claims.
5-year window on Professional · up to 10 years on Institutional. Server-enforced.
Questions
- Does seasonality predict future returns?
- No — and we won't tell you it does. The table shows the historical record; what it means for the future is your judgment to make.