What the Street's numbers are really worth.
Three-scenario DCF valuation driven by analyst consensus estimates — see what Wall Street's own forecasts imply about fair value.
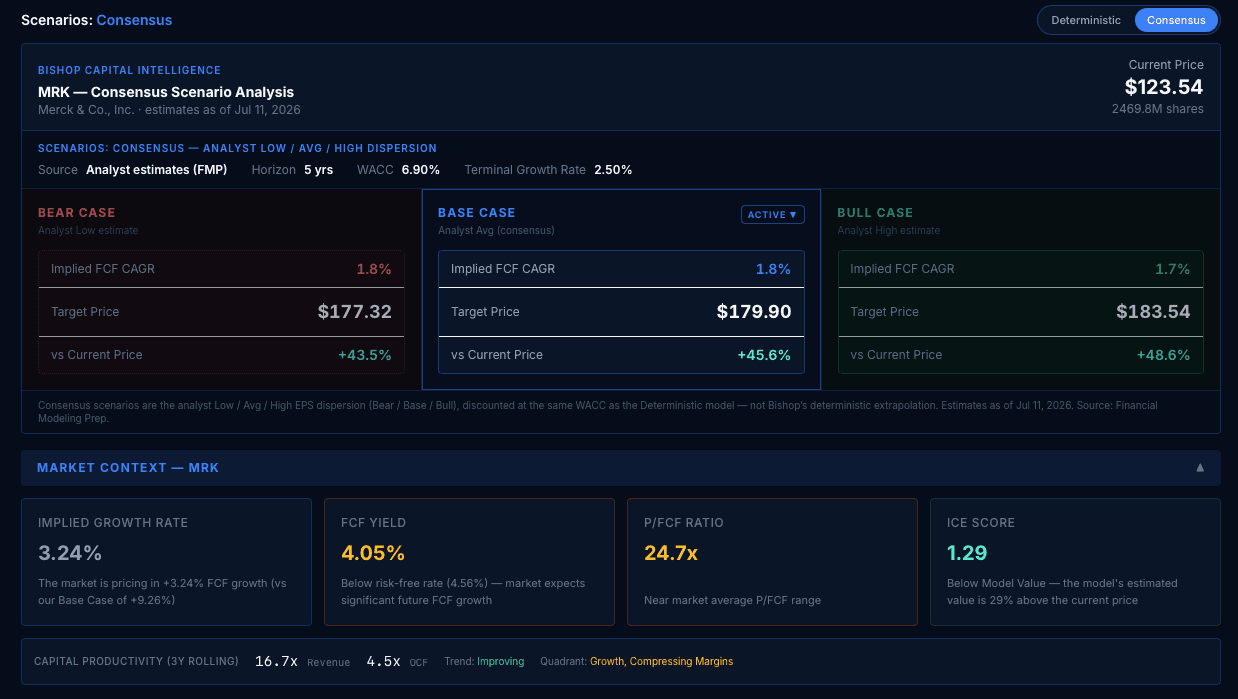
What it tells you
Analysts publish estimates; few publish what those estimates imply. This engine takes consensus forecasts and runs them through the same transparent DCF machinery as the deterministic model, producing bear, base, and bull fair values that are the analyst low, average, and high estimate bands — the Street's actual dispersion, grounded in its expectations rather than historical extrapolation. Comparing the two engines side by side shows you instantly where consensus optimism diverges from what the filings support.
Who it's for
For investors who want to know whether the market's story survives contact with the market's own numbers.
How it works
- Analyst consensus revenue, EBIT, and EBITDA estimates — from Financial Modeling Prep, cached and refreshed daily — are converted to free cash flow year by year: EBIT × (1 − tax) + D&A − CapEx, with the tax rate and capital intensity anchored to the company's own filing history.
- Bear, base, and bull are the actual analyst low / average / high estimate bands — real dispersion, not modeled sensitivities.
- Identical discounting machinery to the deterministic engine — same WACC, same terminal-value math, same share count — so the gap between the two model values isolates the difference in cash-flow assumptions.
- When analyst coverage is too thin or projected cash flows turn negative, the model says so plainly instead of publishing a number.
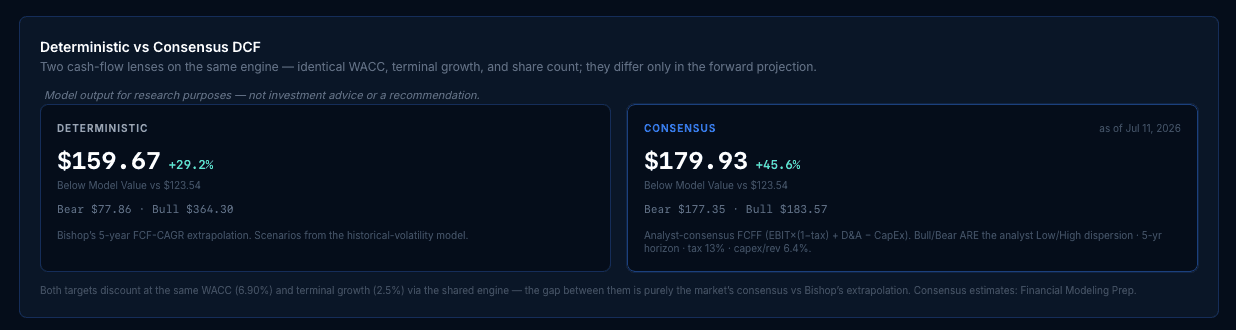
Also in Institutional. Server-enforced — the consensus model is computed only for paid plans.
Questions
- Which engine should I trust?
- Both, for different questions. The deterministic engine asks what the filings support; the consensus engine asks what the Street believes. The gap between them is often the insight.